Debugging and Benchmarking
Use LabVIEW and VeriStand to debug and benchmark custom devices as you would any other code during development.
LabVIEW Debugging Techniques
Custom devices are written in LabVIEW code. You can develop, test, and debug this code in LabVIEW before running the niveristand-custom-device-wizard. Use built-in LabVIEW debugging techniques during development and merge your resulting LabVIEW code into the custom device framework.
A custom device is one of many parts of the system definition. Behavior of LabVIEW code within the custom device framework, such as timing, will likely differ from a stand-alone LabVIEW application. You should benchmark the custom device inside of the VeriStand Engine.
Once custom devices are added to the system definition, they are fully integrated into the VeriStand context. Built-in LabVIEW debugging techniques will no longer be available.
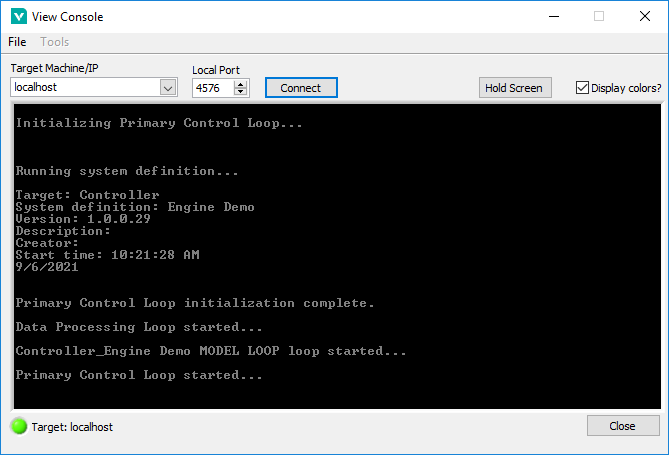
Console Viewer
The Console Viewer is a subcomponent of the VeriStand Real-Time (RT) Engine.
You can install the Console Viewer to the target with NI Measurement and Automation Explorer (MAX). Once installed, the component runs a small UDP daemon that allows the operator to view the console. You can access the Console Viewer from the VeriStand Editor by clicking Tool Launcher » View Console.
Note: You cannot use the Console Viewer on NI Linux Real-Time targets. Instead, connect your NI Linux Real-Time targets to a computer using a serial port to view the output.
The Console Viewer provides a periodic snapshot of the system definition and resulting CPU usage. The viewer can also display debugging messages.
CPU spikes and transients may not be observable. If the system is busy, the Console Viewer may not update. You can use other debugging methods for a more accurate indication of resource utilization.
The Console Viewer is also available as a stand-alone add-on to LabVIEW Real-Time. For more information, refer to Remotely View Console Output of Real-Time Targets.
Custom Error Codes
You can define custom error codes in LabVIEW and distribute them to VeriStand with a custom device.
Copy a custom errors.txt file to VeriStand in the
<Base>\National Instruments\Shared\Errors\Englishdirectory.Add the file as a dependency in the custom device.
Add the file as a dependency in the custom device XML file.
(Optional) For RT targets, deploy the errors.txt file to the error directory on target. Error messages will display in Console Viewer.
For more information, refer to Defining Custom Error Codes to Distribute throughout Your Application.
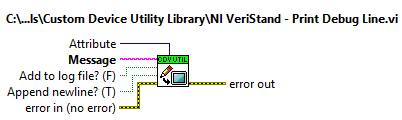
Printing With the Print Debug Line VI
The recommended method of printing to the console is to use the NI VeriStand - Print Debug Line VI.
This VI works on both Windows and RT execution hosts. Use the optional Attribute input to change the color of the text. You can also use the optional Add to log file? (F) input to append the string to the VeriStand log file.
To locate this VI in LabVIEW, navigate to Custom Device API » Utilities.
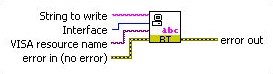
Printing with RT Debug String VI
The RT Debug String VI sends a string to the standard output device.
By default, this VI sends the debug string to the video port. If you have a device capable of serial redirection, the debug string is sent to the serial port.
To locate this VI in LabVIEW, navigate to Real-Time » RT Utilities.
Telemetry Custom Device
The Telemetry Custom Device supports VeriStand benchmarking by logging system channels and monitoring target resources. Usage data is logged to a TDMS file on the target that is running the VeriStand Engine.
System Channels
VeriStand includes system channels that provide information on internal processes. Several of these system channels are useful for benchmarking and debugging.
The following table contains examples of debugging and benchmarking system channels.
System Channel |
Description |
|---|---|
HP Count |
The number of times the Primary Control Loop reported being late. |
HP Loop Duration |
The duration of the Primary Control Loop in nanoseconds. |
LP Count |
The number of times the Data Processing Loop reported being late. |
Model Count |
The number of times the models have not completed their execution in time. |
If the value of the count channels increase over time, the target is not achieving the desired loop rates. You can use the system channels in conjunction with an alarm or procedure to handle events.
System Monitor Custom Device
The System Monitor Custom Device tracks memory resources and CPU usage on an RT target running the VeriStand Engine. Set the update rate (Hz) in System Explorer to determine how often the custom device checks CPU and memory usage and sends them to the corresponding channel.
Note: The VeriStand System Monitor can only be used on an RT target.
Distributed System Manager
You can use the NI Distributed System Manager (DSM) to monitor the CPU and memory resources of an RT target. You must install System State Publisher on the RT target.
This component runs a small daemon that publishes the system state to DSM. For more information, refer to Monitor RT target resources.
System State Publisher provides a periodic snapshot of utilization. CPU spikes and transients may not be observable. If the system is busy, DSM may not update. You can use other debugging methods for a more accurate indication of resource utilization.
Additional Debugging Options for VeriStand
Upon request, NI can provide advanced debugging tools to help you resolve certain custom device issues. These tools are a last resort when all other debugging options have been exhausted. For more information, contact NI.